


News
2024.10.04 Fri
Release of synergistic cloud images by EarthCARE sensors
– Accurate cloud observations by combining sensors with different measurement methods –
The Earth Cloud Aerosol and Radiation Explorer “EarthCARE” satellite (Japanese name: Hakuryu), which was launched at 7:20 a.m. (JST) on 29 May 2024, is continuing its observations. The Cloud Profiling Radar (CPR), developed by the Japan Aerospace Exploration Agency (JAXA) and the National Institute of Information and Communications Technology (NICT), conducted its first observations on 12 and 13 June 2024. The CPR observed the cloud area in a stationary front, called the Baiu front, over the ocean at east of Japan, measured the internal structure of cloud, and succeeded in the world’s first measurement of vertical cloud motion from space.
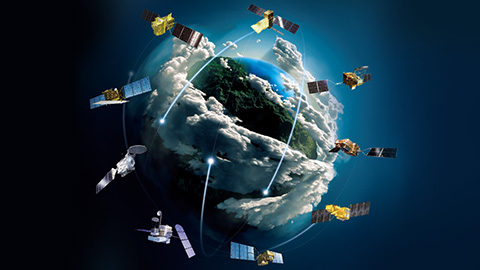
EarthCARE is equipped with four sensors with different observation methods: radar, lidar, imager, and radiometer. EarthCARE was jointly developed by the European Space Agency (ESA) and Japan, with ESA responsible for the development and operation of three of its sensors. ESA released the first images from the Broadband Radiometer (BBR) on 5 July, the first images from the Multispectral Imager (MSI) on 24 July, and the first images from the Atmospheric Lidar (ATLID) on 21 August.
■Synergistic cloud images by sensors onboard EarthCARE
A distinctive feature of the EarthCARE satellite observations is “synergy observation,” in which all four sensors observe a single target location at the same time. By combining data from each sensor, it is possible to provide new information that cannot be obtained from a single sensor alone. This is the first time that these four types of sensors have been installed on one satellite.
JAXA has developed data processing methods in collaboration with NICT, Kyushu University, National Institute for Environmental Studies, Tokai University, the University of Tokyo, and Remote Sensing Technology Center of Japan (RESTEC). In this web story, we present for the first time the synergistic cloud images (Figures 1 and 2) obtained through the synergy observation.
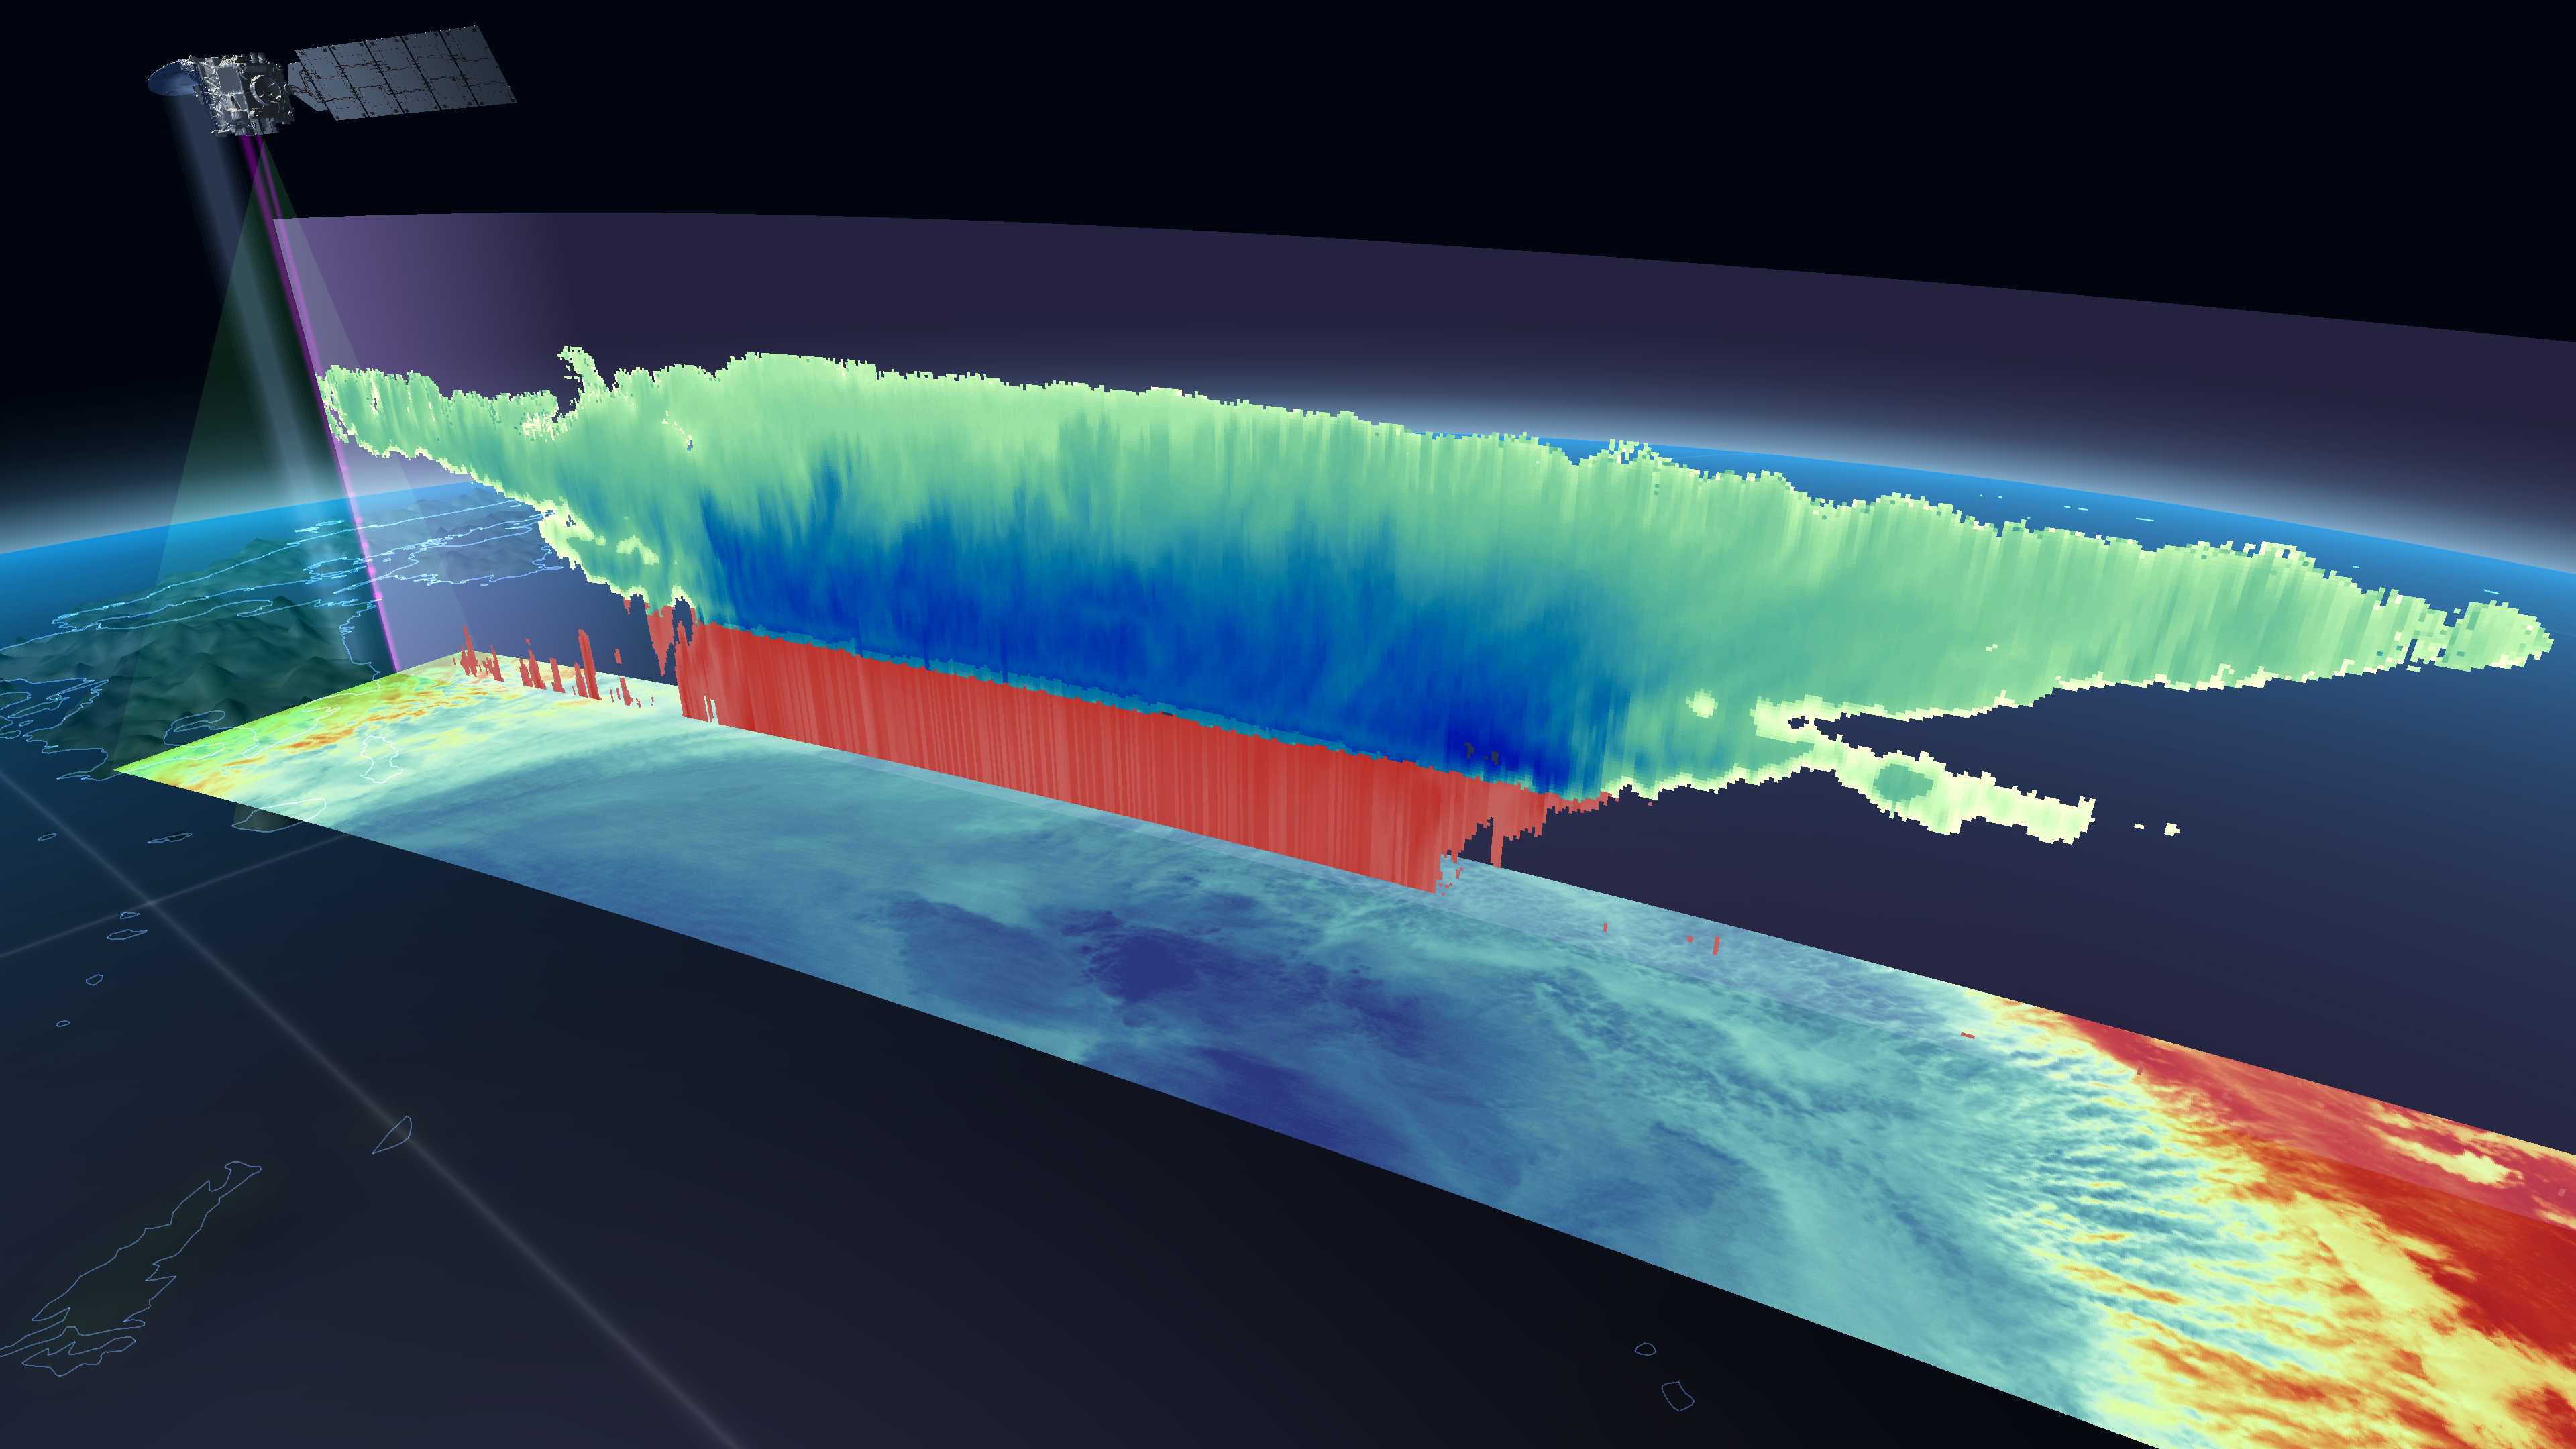
Figure 2: Video of the observation results shown in Figure 1. (c) JAXA/ESA
Typhoon Shanshan (2024), which formed in the Mariana Islands on 22 August, slowed down near Japan and approached Amami Oshima, Japan, with extreme strength on 27 August.
It then landed at Kagoshima Prefecture around 8am on 29 August. The track of Typhoon Shanshan (2024) was extremely difficult to predict, as it changed course several times and caused great damage in many areas, including heavy rain, landslides, and tornadoes. EarthCARE observed the cloud area of Typhoon Shanshan (2024), whose center was located over the sea near Amami Oshima Island, Japan, at 17UTC on 27 August (Figure 3).
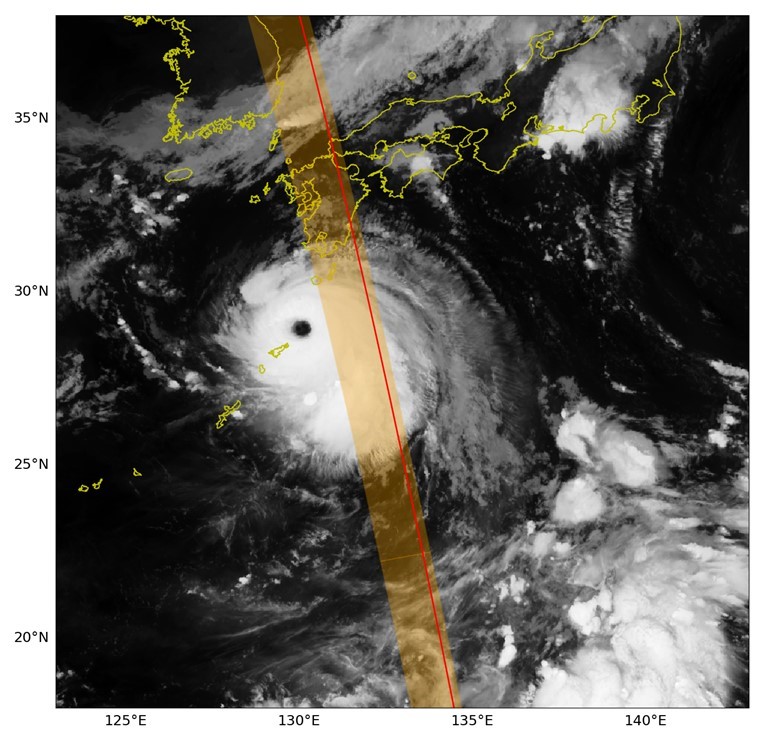
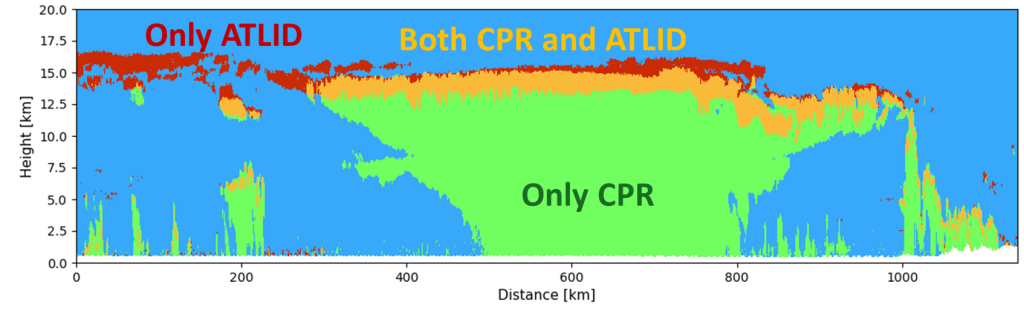
Figure 1 shows the cloud structure of Typhoon Shanshan (2024) captured by EarthCARE’s synergistic observations. Figure 2 shows a video of the observation results. The CPR is sensitive to thick cloud, while the ATLID is sensitive to thin cloud. Combining the CPR and the ATLID allows observation of a wider range of cloud types. In addition, in cloud areas where both the CPR and the ATLID can observe, the cloud amount can be estimated more accurately using both sensors. Figure 4 shows the difference in cloud vertical distribution observed by the CPR and the ATLID. Furthermore, the MSI has an observation width of approximately 150 km (Figure 3) and can capture the horizontal structure of cloud associated with Typhoon Shanshan (2024). Therefore, by combining the MSI, it is possible to estimate the amount of cloud more accurately.
Cloud characteristics such as cloud height, type, and how they overlap greatly affect the Earth’s climate system. However, the impact of cloud on global warming has not been fully quantified, which is the largest source of uncertainty in global warming projections. It is expected that the combination of precise cloud observation data from these synergistic observations, Doppler observations of cloud particles by the CPR, and numerical models will contribute to a greater scientific understanding of climate change mechanisms, in order to quantitatively evaluate the impact of cloud on global warming. Utilizing EarthCARE data will lead to more accurate climate change predictions and contribute to the consideration of climate change adaptation.
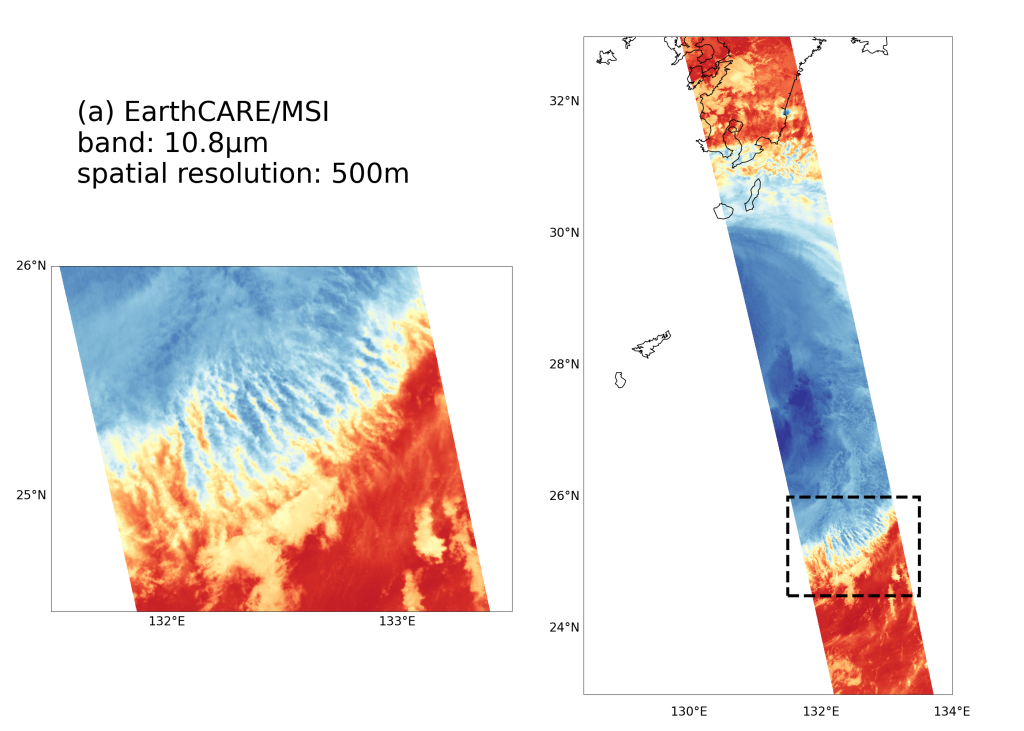
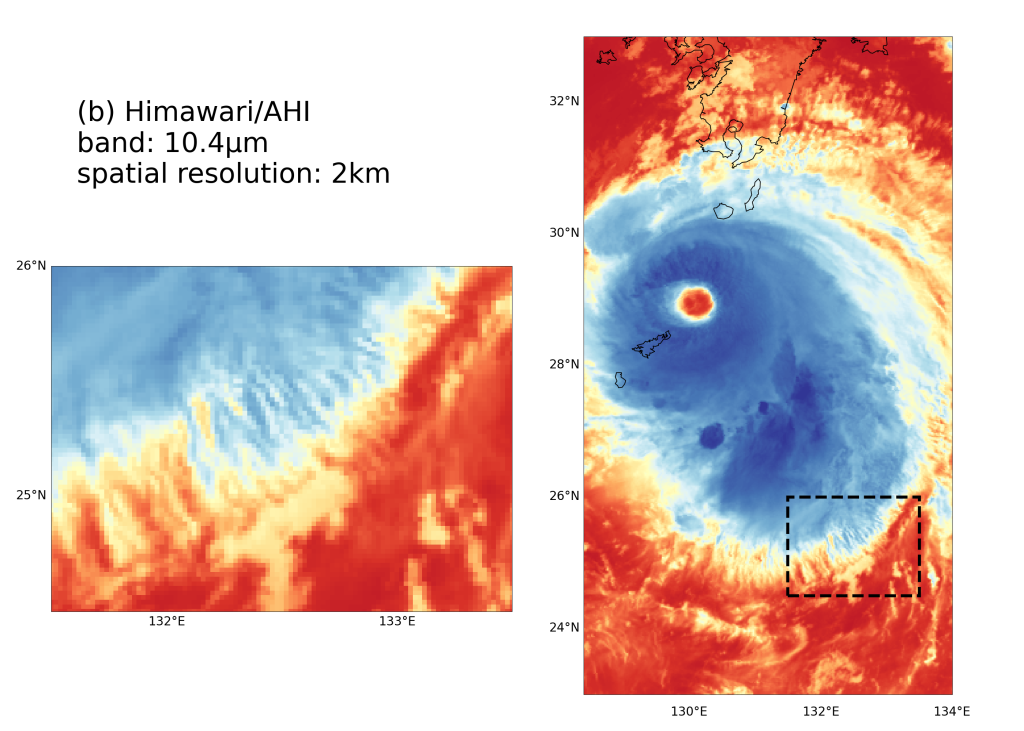
(c) Figure 5(a) JAXA/ESA, Figure 5(b) JAXA/JMA.
Figure 5 shows the difference in horizontal resolution between the MSI and the AHI (Advanced Himawari Imager) on board the Himawari-9 satellite. The MSI is a similar sensor to the AHI, but the horizontal resolution of the MSI (10.8 μm band) is 500 m, while that of the AHI (10.4 μm band) is 2 km. The MSI has a finer resolution, which allows it to see cloud distribution in more detail. Furthermore, by combining the MSI with the CPR and the ATLID, the information becomes more accurate estimation of cloud.
■Examples of EarthCARE’s orbit and CPR observation
The CPR has continued observations since June 2024. Here we show an example from 22 August 2024. Figure 6 shows an orbit of EarthCARE. EarthCARE orbits the Earth approximately 16 times a day, with each orbit taking approximately 90 minutes.
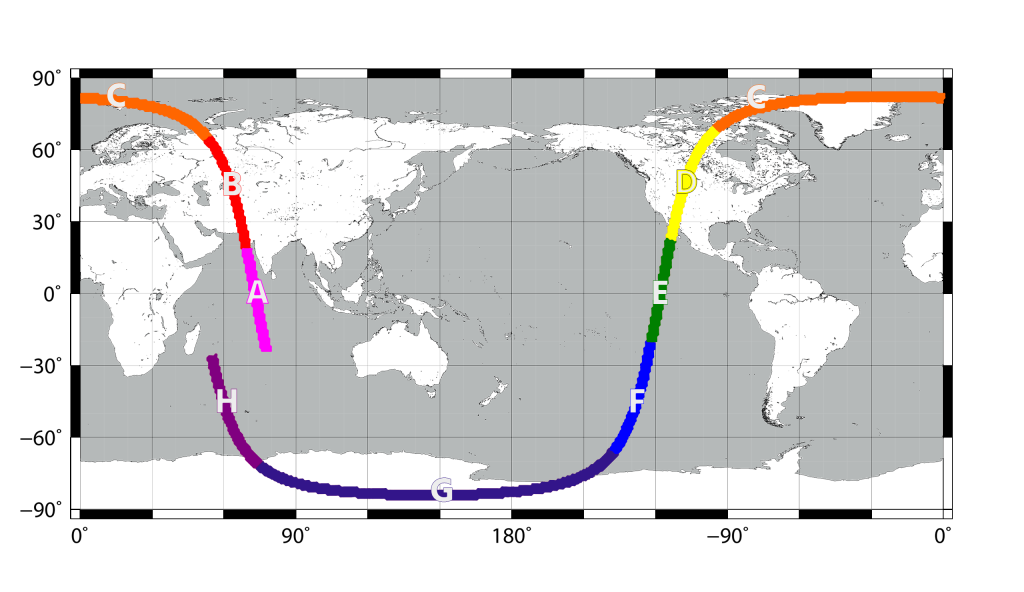
Each orbit is divided into eight scenes, each labeled with a letter from A to H. (c) JAXA
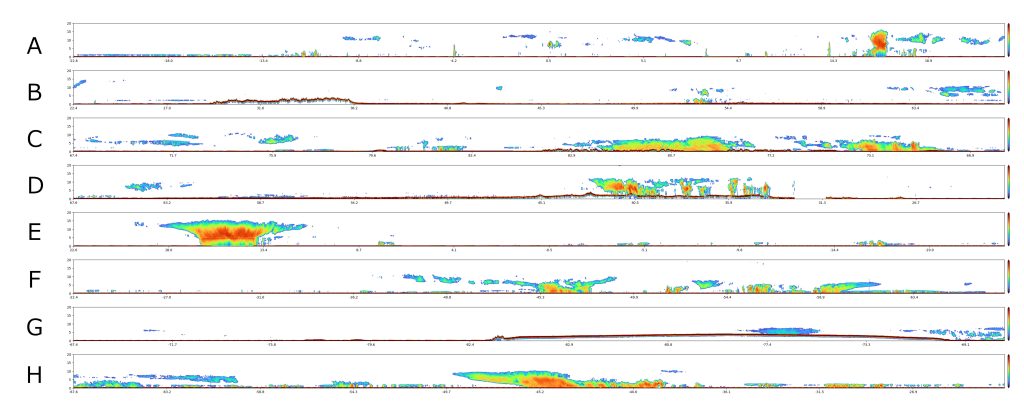
(22 August 2024, orbit number: 1337). (c) JAXA/NICT/ESA
Figure 7 shows the vertical distribution of the radar reflectivity of the CPR observed along the orbit shown in Figure 6.
As shown in Figure 7, the CPR observes various cloud around the world. Figure 8 shows the vertical distribution of radar reflectivity and Doppler velocity for a tropical cyclone in the northeast Pacific Ocean observed at 22UTC on 22 August 2024. The CPR transmits radio waves from space to the Earth and receives the waves that bounce back after hitting cloud particles and raindrops in the sky. The radar reflectivity (Figure 3a) represents the strength of these “bounced radio waves”. Higher values mean that there are more cloud droplets or raindrops in the sky. The figure shows that this tropical cyclone has a cloud structure that has developed from the lower levels to about 15 km above the ground.
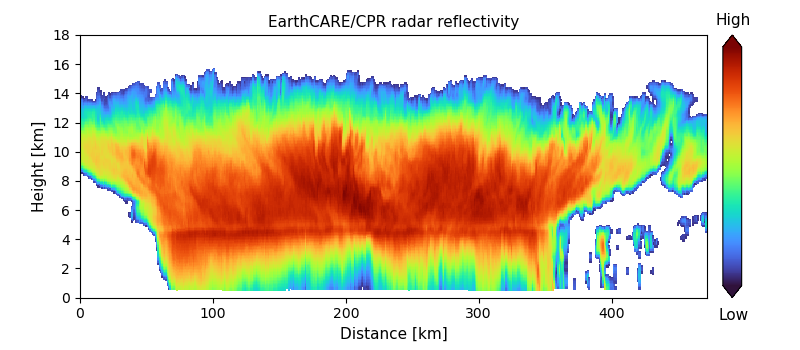
(22 UTC, 22 August 2024) (c) JAXA/NICT/ESA
Doppler velocity (Figure 8b) is the vertical motion of cloud particles or raindrops measured based on the Doppler effect. The Doppler effect is famously known as the change in pitch of the sound of an ambulance as it passes by. The figure shows that the Doppler velocity increases downward at altitudes below about 5 km. This corresponds to the fast-falling speed of the raindrops, and we can see that in this tropical cyclone, rain is falling at altitudes below about 5 km.
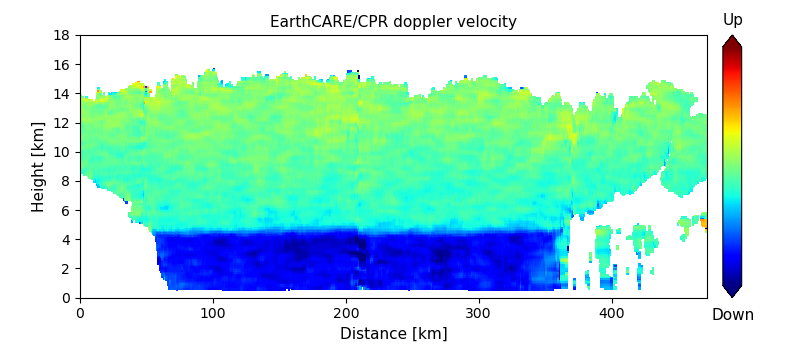
(22 UTC, 22 August 2024) (c) JAXA/NICT/ESA
■ Comprehensive observation from cloud to rain in collaboration with the Global Precipitation Measurement (GPM) Core Observatory
At the same time, the Global Precipitation Measurement (GPM) Core Observatory also passed over the same location and observed the same rainy cloud. GPM is a joint US-Japan mission. The GPM Core Observatory was launched on the Japanese H-IIA rocket from the Tanegashima Space Center, Japan, in February 2014 and is still in operation today. The GPM Core Observatory is equipped with the world’s first Dual-frequency Precipitation Radar (DPR), developed by JAXA and NICT.
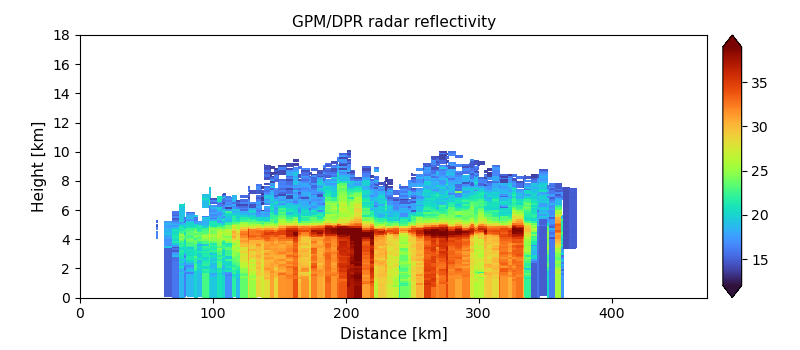
Figure 9 shows the radar reflectivity observed by the DPR on the same cross section as the CPR shown in Figure 8. Both radars emit radio waves and measure the returning reflected signals, but they use different radio frequencies. DPR observes at frequencies suitable for measuring raindrops (13 GHz and 35 GHz), while the CPR observes at a frequency suitable for measuring much smaller cloud droplets (94 GHz).
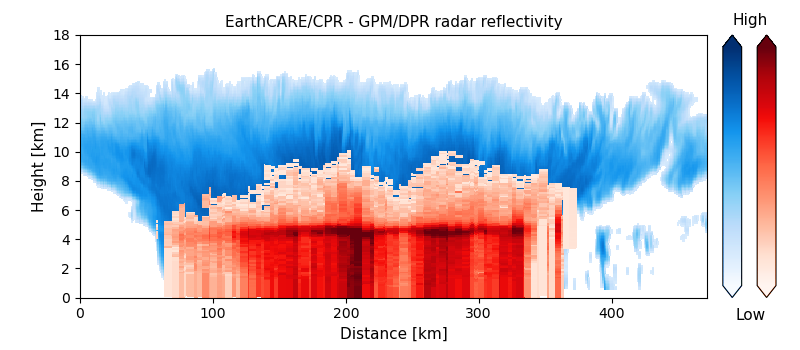
Blue indicates the radar reflectivity of the CPR, and red indicates the radar reflectivity of GPM/DPR. (c) JAXA/NICT/ESA
Figure 10 shows the radar reflectivity of the DPR superimposed on the radar reflectivity of the CPR. While the DPR captures the distribution of large raindrops and snowflakes that have already grown, the CPR can capture the interior of cloud that are even higher. In addition, the CPR is the first in the world to have the ability to measure Doppler velocity, allowing us to measure how these particles are moving up and down inside the cloud. On the other hand, the DPR can observe the precipitation structure within cloud in three dimensions. By combining the strengths of the CPR and the DPR, it is now possible to make comprehensive observations, from cloud to rain.
The cloud and precipitation process, in which cloud droplets grow into rain, plays an important role in numerical models that predict heavy rainfall and future climates. It is expected that comprehensive observations from cloud to rain by the collaboration of EarthCARE and the GPM Core Observatory will help us understand the mechanism by which cloud droplets grow into rain and improve the cloud and precipitation processes in the numerical model, thereby improving the accuracy of predictions.
Search by Year
Search by Categories
Tags
-
#Agreement
-
#Application
-
#Award
-
#Climate
-
#DAICHI (ALOS)
-
#DAICHI-2 (ALOS-2)
-
#DAICHI-3 (ALOS-3)
-
#DAICHI-4 (ALOS-4)
-
#Disaster Management
-
#EarthCARE/CPR
-
#Education
-
#GPM/DPR
-
#HIMAWARI
-
#IBUKI (GOSAT)
-
#IBUKI GW (GOSAT-GW)
-
#IBUKI-2 (GOSAT-2)
-
#KIZUNA (WINDS)
-
#SHIKISAI (GCOM-C)
-
#SHIZUKU (GCOM-W)
-
#Tour and Exhibits
-
#TSUBAME (SLATS)
Related Tags
Related News
- News 2026.05.12 Tue
- News 2025.12.01 Mon
- News 2025.11.27 Thu
- News 2025.10.01 Wed
- News 2025.07.08 Tue


