


News
2025.03.17 Mon
Cloud and aerosol observation data (Level 2 products) from the EarthCARE satellite (Hakuryu) is now available to the public!
The Japan Aerospace Exploration Agency (JAXA) began providing data on clouds and aerosols (Level 2 products) from the Earth Cloud Aerosol and Radiation Explorer “EarthCARE” satellite (Hakuryu: Japanese nickname) to the public from March 17, 2025.
Hakuryu is equipped with a Cloud Profiling Radar (CPR) developed by JAXA and the National Institute of Information and Communications Technology (NICT), as well as Atmospheric Lidar (ATLID), Multi-spectral Imager (MSI), and Broadband Radiometer (BBR), all of which were developed by the European Space Agency (ESA).
Starting January 14, 2025, we began providing Level 1 products, which are obtained by converting the observation data from each individual sensor into engineering values. Level 2 products are data that are converted from the engineering values of Level 1 products into atmospheric physical values. Level 2 products are further classified into those created from each sensor’s observables (one-sensor products) and those created from integrating information from multiple sensors (synergy products). For more information about product types, please click here.
JAXA has been developing data processing methods in collaboration with NICT, Kyushu University, National Institute for Environmental Studies, Tokai University, University of Tokyo, and the Remote Sensing Technology Center of Japan (RESTEC). The Level 2 products that have been made generally available this time are the one-sensor products and the CPR and ATLID synergy product. The three-sensor synergy product (CPR, ATLID, and MSI) as well as the four-sensor synergy product including BBR are scheduled for public release around November to December 2025.
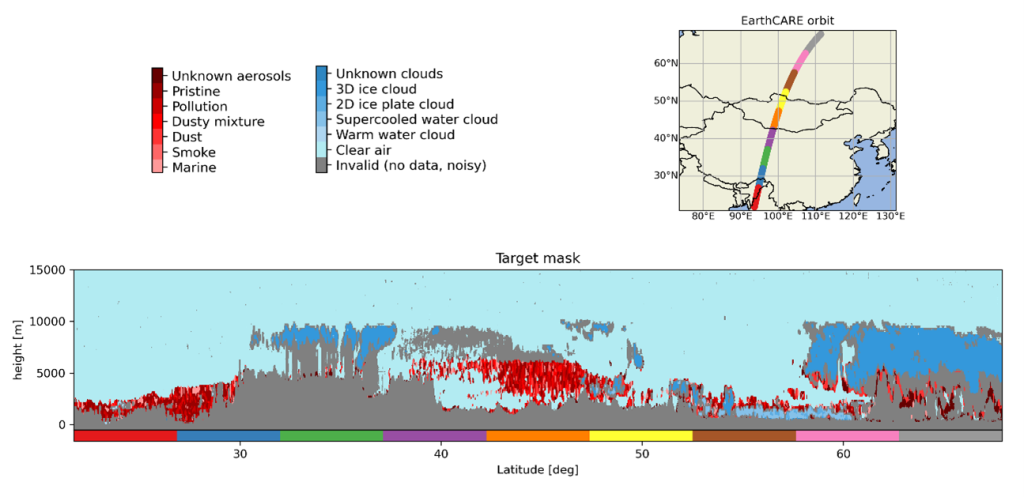
■Aerosol Observation by ATLID
Dust storms frequently occur in the Gobi and Taklamakan Deserts, and are known as major sources of dust in Asia. Dust storms are particularly likely to occur in the spring (March to May) and can reach the upper troposphere. This dust can sometimes be carried across ocean by the westerly winds, a phenomenon known in Japan as “yellow sand.” Figure 1 shows the vertical distribution of aerosols, including dust, in the Gobi Desert as observed by ATLID. The orange area corresponds to the location of the Gobi Desert, and aerosols are indicated as in red at an altitude of around 5 km. ATLID Level 2 products include aerosol species identification as well as classification of aerosols, clouds, and clear sky regions. The information on the distribution of aerosol including dust observed by ATLID will contribute to improving the accuracy of yellow sand forecasts.
■CPR-ATLID Synergy Product
Figure 2 shows an example of air vertical velocity and subsidence velocity retrieved from both CPR and ATLID observation data. Level 1 product provides “Doppler velocity” which measures how cloud particles and raindrops are moving up and down, using a phenomenon known as the “Doppler effect”. Level 2 products can separate the Doppler velocity into two components, “air vertical velocity” and “sedimentation velocity”, by conducting a detailed analysis of the types and amounts of particles present in the clouds. Air vertical velocity indicates the upward and downward movement of the atmosphere itself, such as air currents (updrafts and downdrafts). On the other hand, sedimentation velocity refers to the speed at which cloud particles or raindrops fall under the influence of gravity. This allows for a detailed understanding of the movements occurring inside the clouds. These are very challenging variables with many development elements, but they are also extremely valuable scientifically. Hakuryu has realized these variables as satellite data for the first time in the world, making them particularly noteworthy.
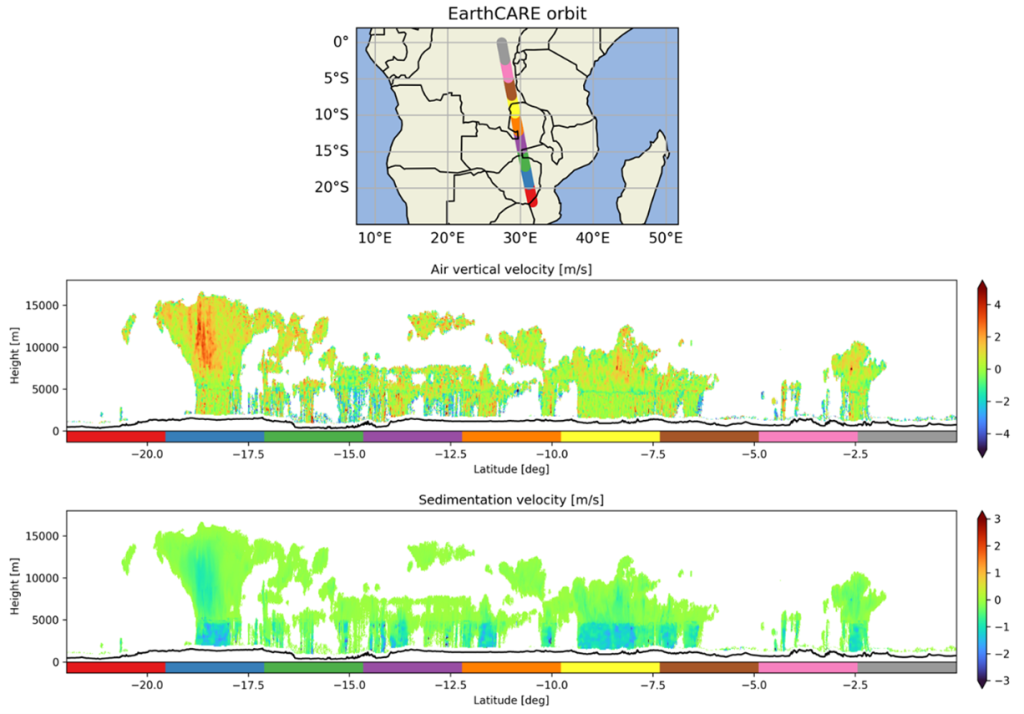
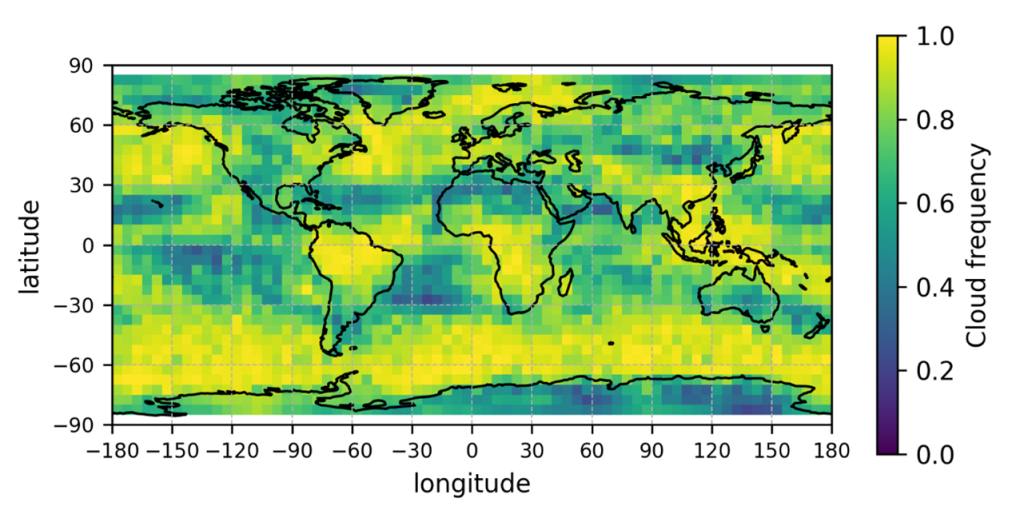
Figure 3 shows the global distribution of cloud cover (February 2025) based on the CPR and ATLID synergy product. We can see that there are many clouds in the Amazon in South America and on the equator in Africa, but there are few clouds in the Sahara Desert in northern Africa and on the Arabian Peninsula. Over the oceans along the western coast of the continents between latitudes 10 and 20 degrees, subtropical high-pressure systems develop and there tends to be few clouds. Additionally, there are areas in the eastern equatorial Pacific Ocean with low sea surface temperatures and few clouds. Cloudy areas are seen over the mid-latitude oceans along the east coast of continents in the Northern Hemisphere and over the mid-latitude oceans in the Southern Hemisphere. This is an area of frequent low-pressure activity called a storm track. As you can see, there are areas in the world with a lot of clouds and areas with less clouds.
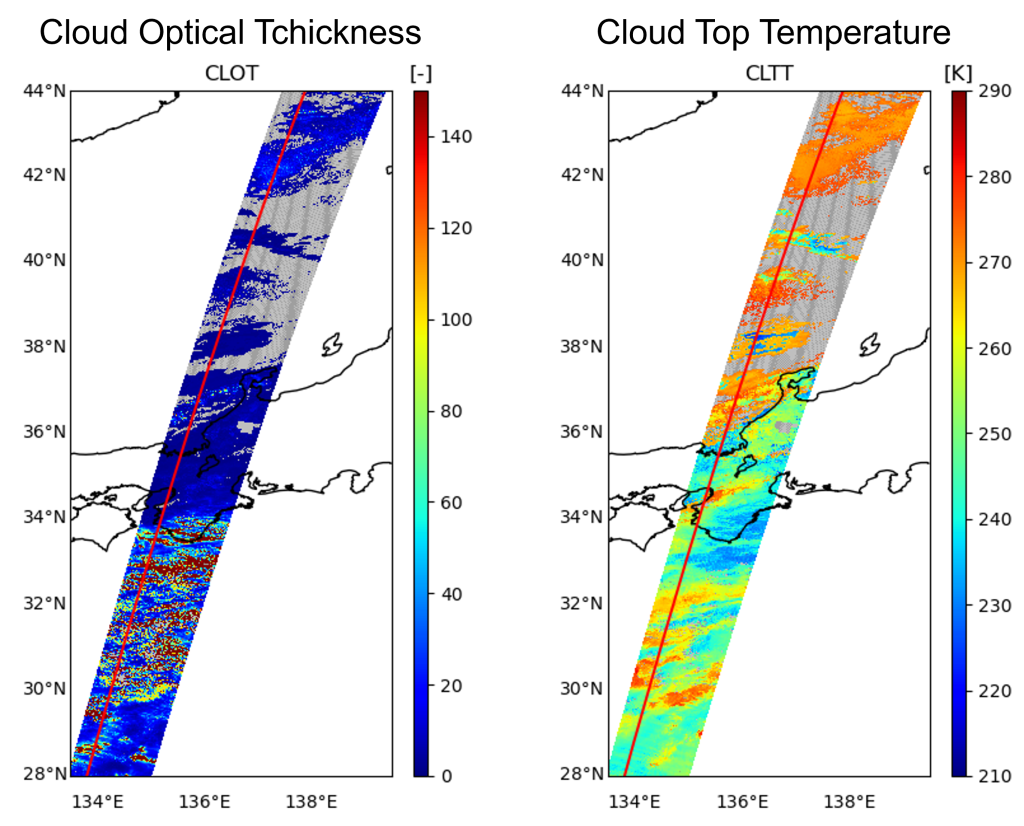
■Cloud Horizontal Distribution by MSI
Figure 4 shows the horizontal distribution of clouds over Japan observed by MSI on February 16th. The left side of the figure shows the physical quantity that represents the thickness of the clouds (cloud optical thickness), and the right side shows the temperature at the top of the clouds (cloud top temperature). On this day, thin clouds spread across the Sea of Japan, and thick clouds were distributed around the southern part of the Kii Peninsula and on the Pacific Ocean.
Since MSI can observe the horizontal distribution of clouds, EarthCARE can capture the three-dimensional structure of clouds by combining with the vertical distribution observed by CPR and ATLID.
Hakuryu observation data is available in public on the JAXA and ESA websites.
• JAXA website
• ESA website
One of the challenges in predicting climate change is predicting how clouds will change when temperatures rise due to increases in carbon dioxide and other factors, and whether these changes will accelerate or slow down global warming. In order to quantitatively evaluate the impact of clouds on global warming, it is important to scientifically understand what heights of clouds move to what heights during global warming and how the characteristics of clouds change. In recent years, advances in observational technology and numerical models have led to progress in research on the physical processes of clouds, and our understanding of how clouds behave during global warming has also deepened. However, the impact of clouds on global warming has yet to be fully quantified, and remains the largest source of uncertainty in global warming projections. By utilizing the Hakuryu data, we will evaluate and improve models that predict future climate. This will lead to more accurate climate change predictions and contribute to the consideration of adaptation measures to climate change.
Search by Year
Search by Categories
Tags
-
#Agreement
-
#Application
-
#Award
-
#Climate
-
#DAICHI (ALOS)
-
#DAICHI-2 (ALOS-2)
-
#DAICHI-3 (ALOS-3)
-
#DAICHI-4 (ALOS-4)
-
#Disaster Management
-
#EarthCARE/CPR
-
#Education
-
#GPM/DPR
-
#HIMAWARI
-
#IBUKI (GOSAT)
-
#IBUKI GW (GOSAT-GW)
-
#IBUKI-2 (GOSAT-2)
-
#KIZUNA (WINDS)
-
#SHIKISAI (GCOM-C)
-
#SHIZUKU (GCOM-W)
-
#Tour and Exhibits
-
#TSUBAME (SLATS)
Related Tags
Related News
- News 2026.05.12 Tue
- News 2025.12.01 Mon
- News 2025.11.27 Thu
- News 2025.10.01 Wed
- News 2025.07.08 Tue


